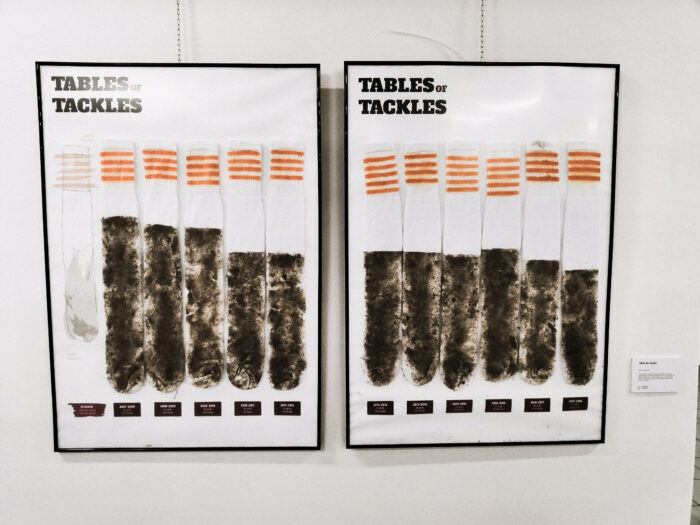
Table for Tackle

By Paolo Vernocchi

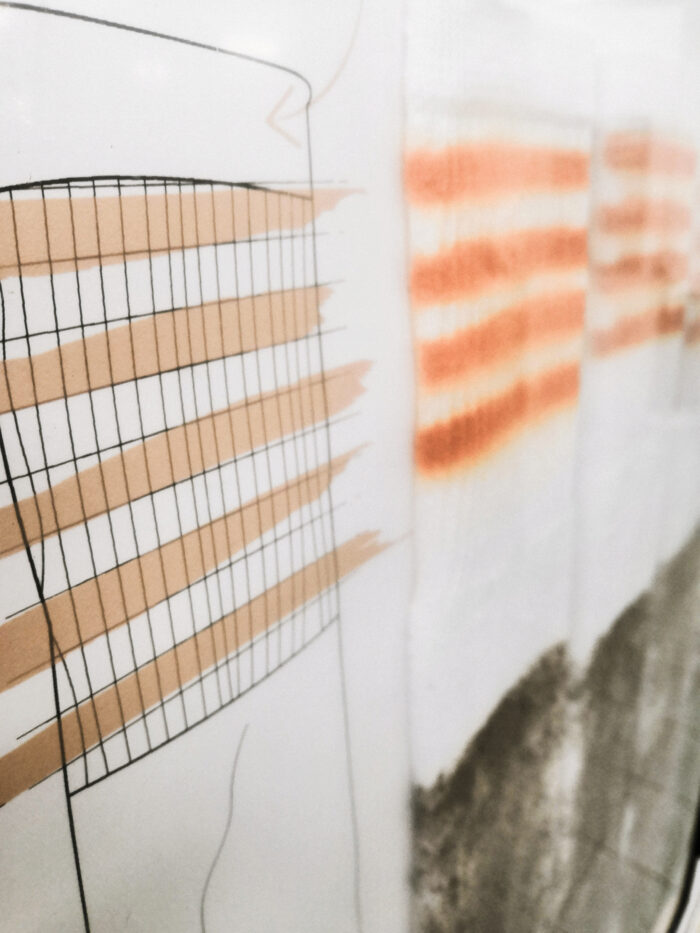
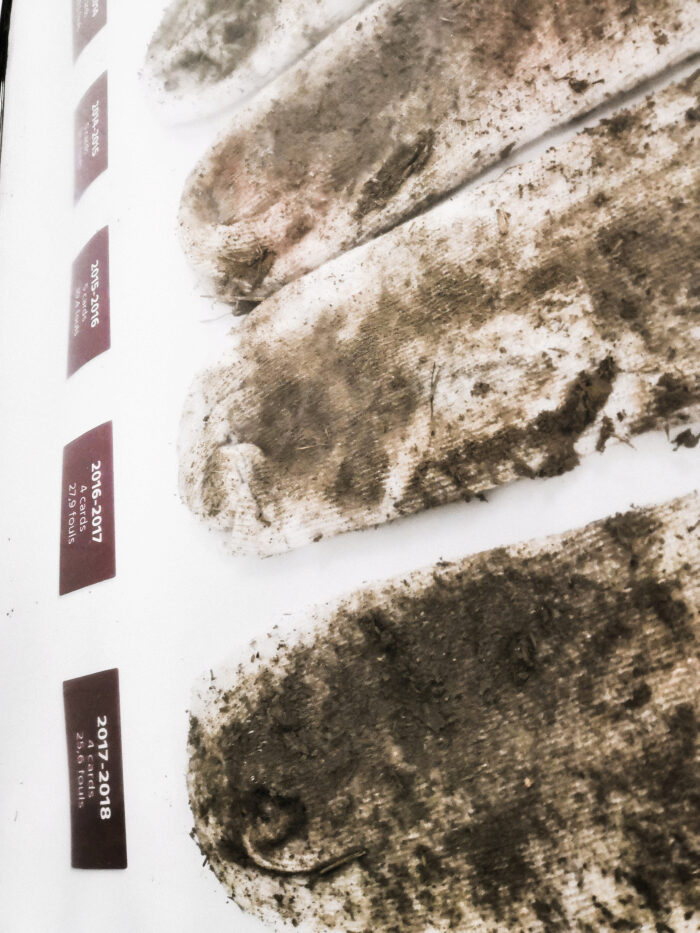
The installation visualizes the amount of fouls in Italian soccer championship: the sock is the main symbol chosen to represent the toughness of the sport because it is the first thing that gets dirty during a match and keeps tracks of all the episodes happened in the ninety minutes of the game.

Featured image of the project Table for Tackle Complementary image of the project Table for Tackle Complementary image of the project Table for Tackle

Metaphor used:

To visualize the information I tried to use as a metaphor the socks: in a game is certainly the first garment that gets dirtier and that keeps track of all the faults committed: the more the game is “ dirty “/ unfair (fouls whistled in a match) the more the sock is dirty. To show the cards per game I decided to use the aesthetic detail of the old socks: the height of the coloured line in the sock is proportional to the number of cards taken out during the whole game.

Intended Meaning:

In this way, my infopoetry wants to show a kind of timeline on the style of the game in the last twelve years where you can reflect on the referee’s severity compared to a possible change in the way of playing this sport.

Source:

http://www.football-data.co.uk/