Highs and Lows
By Matteo Sacchi
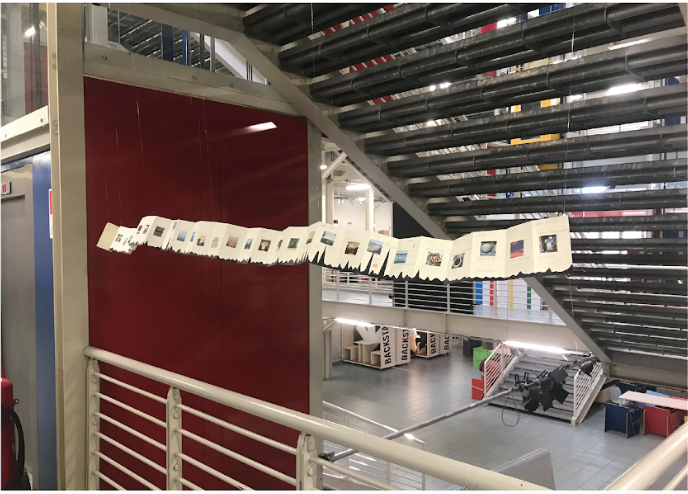
A trendline shows how many floors I climbed every day for the past 365 days (data from apple health), I want to compare this data to the activity I did in that period of time (geolocalization from pictures I took with the smartphone). The aim is to point out the different habits I have during university time and holiday time.