Behind the Social Media: Unveiling Economic Realities in 3D Travel Chronicles

By Hanya Nie

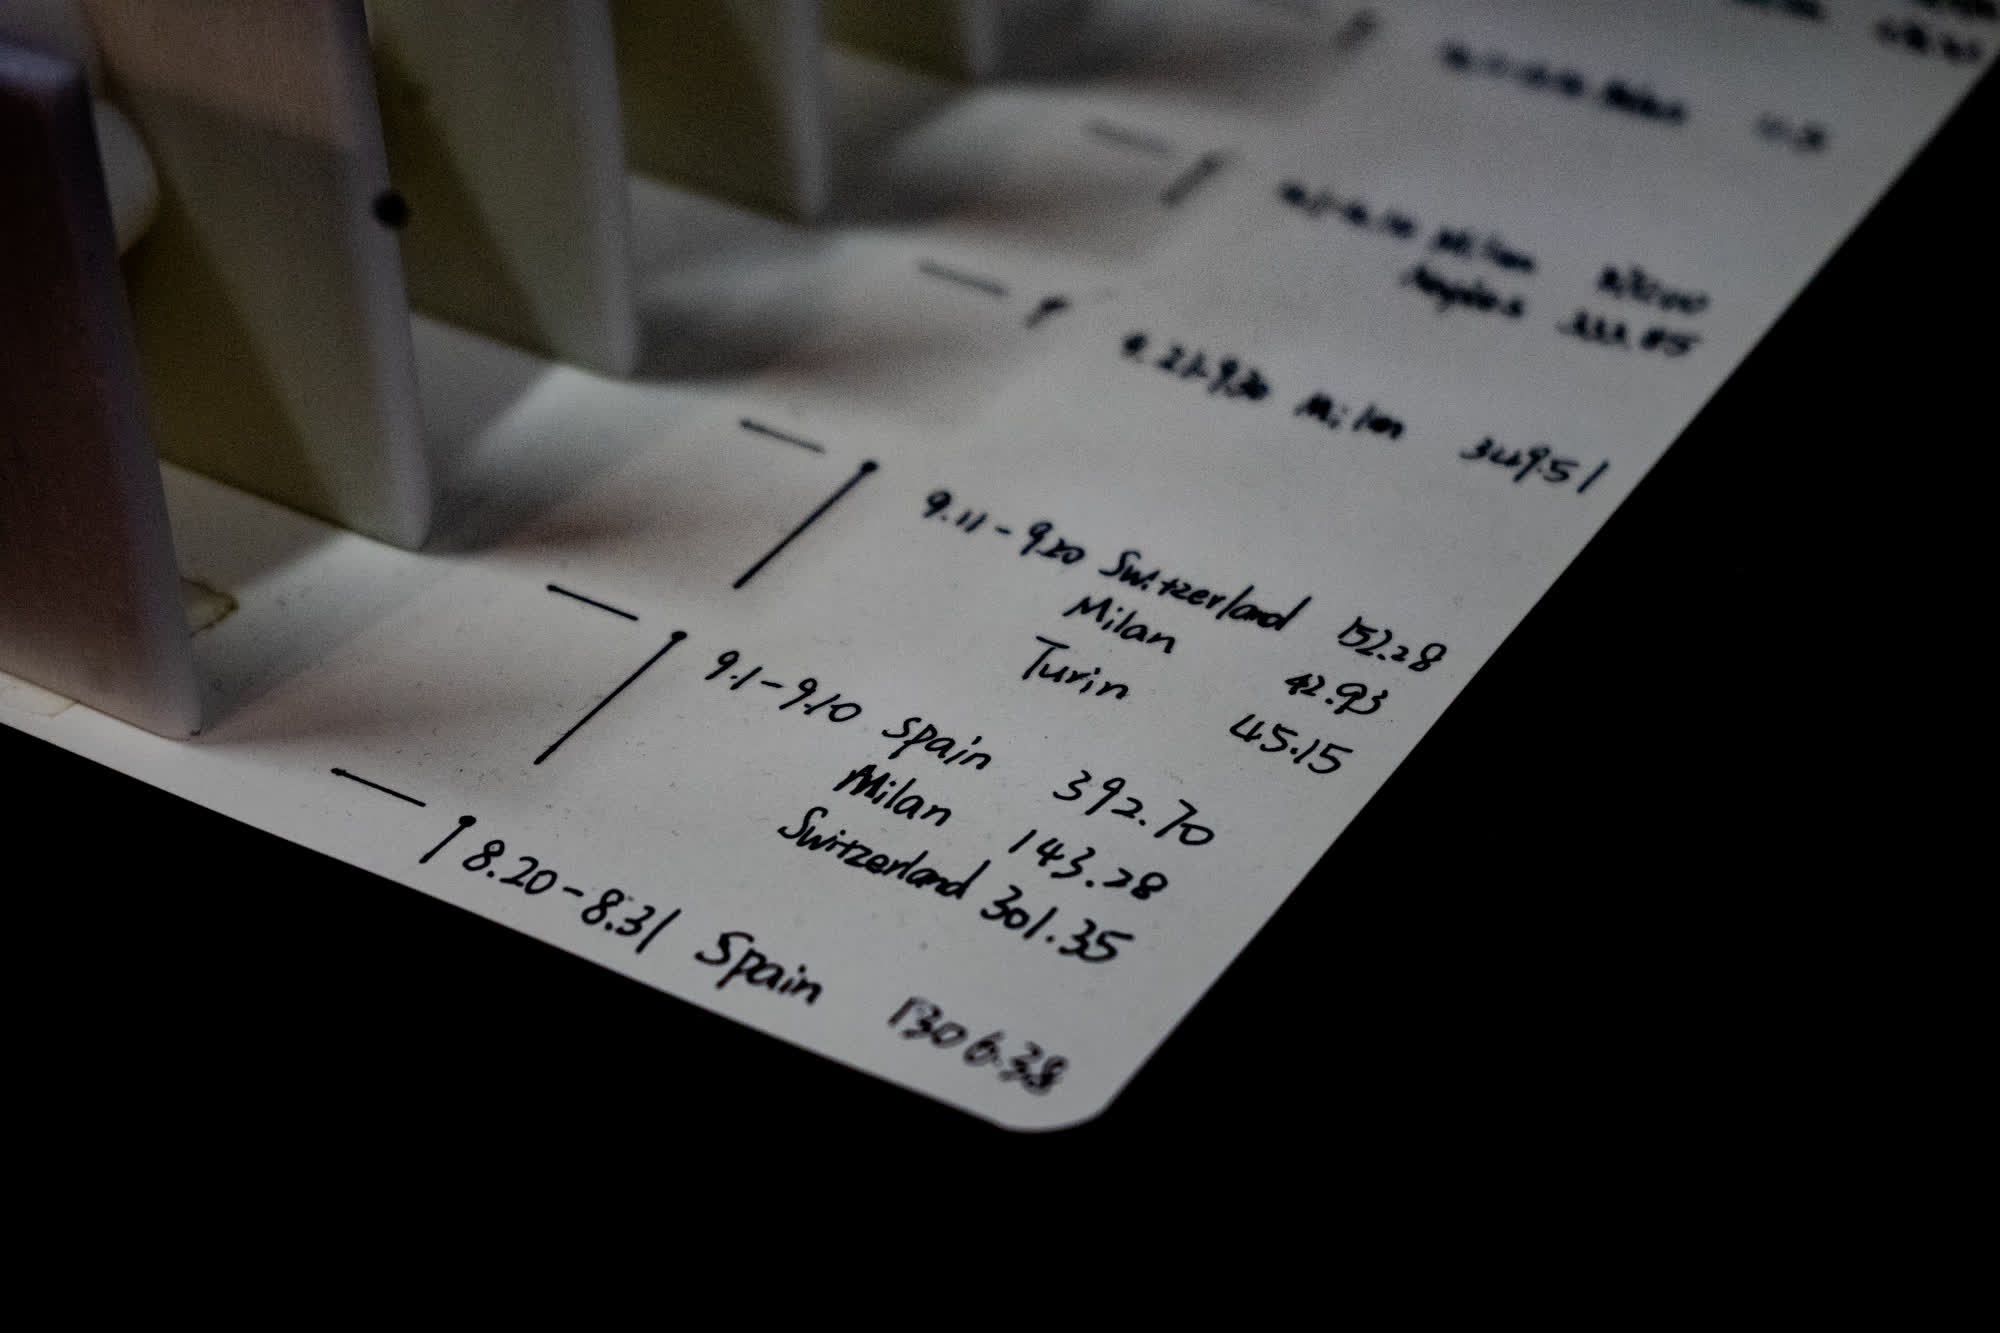
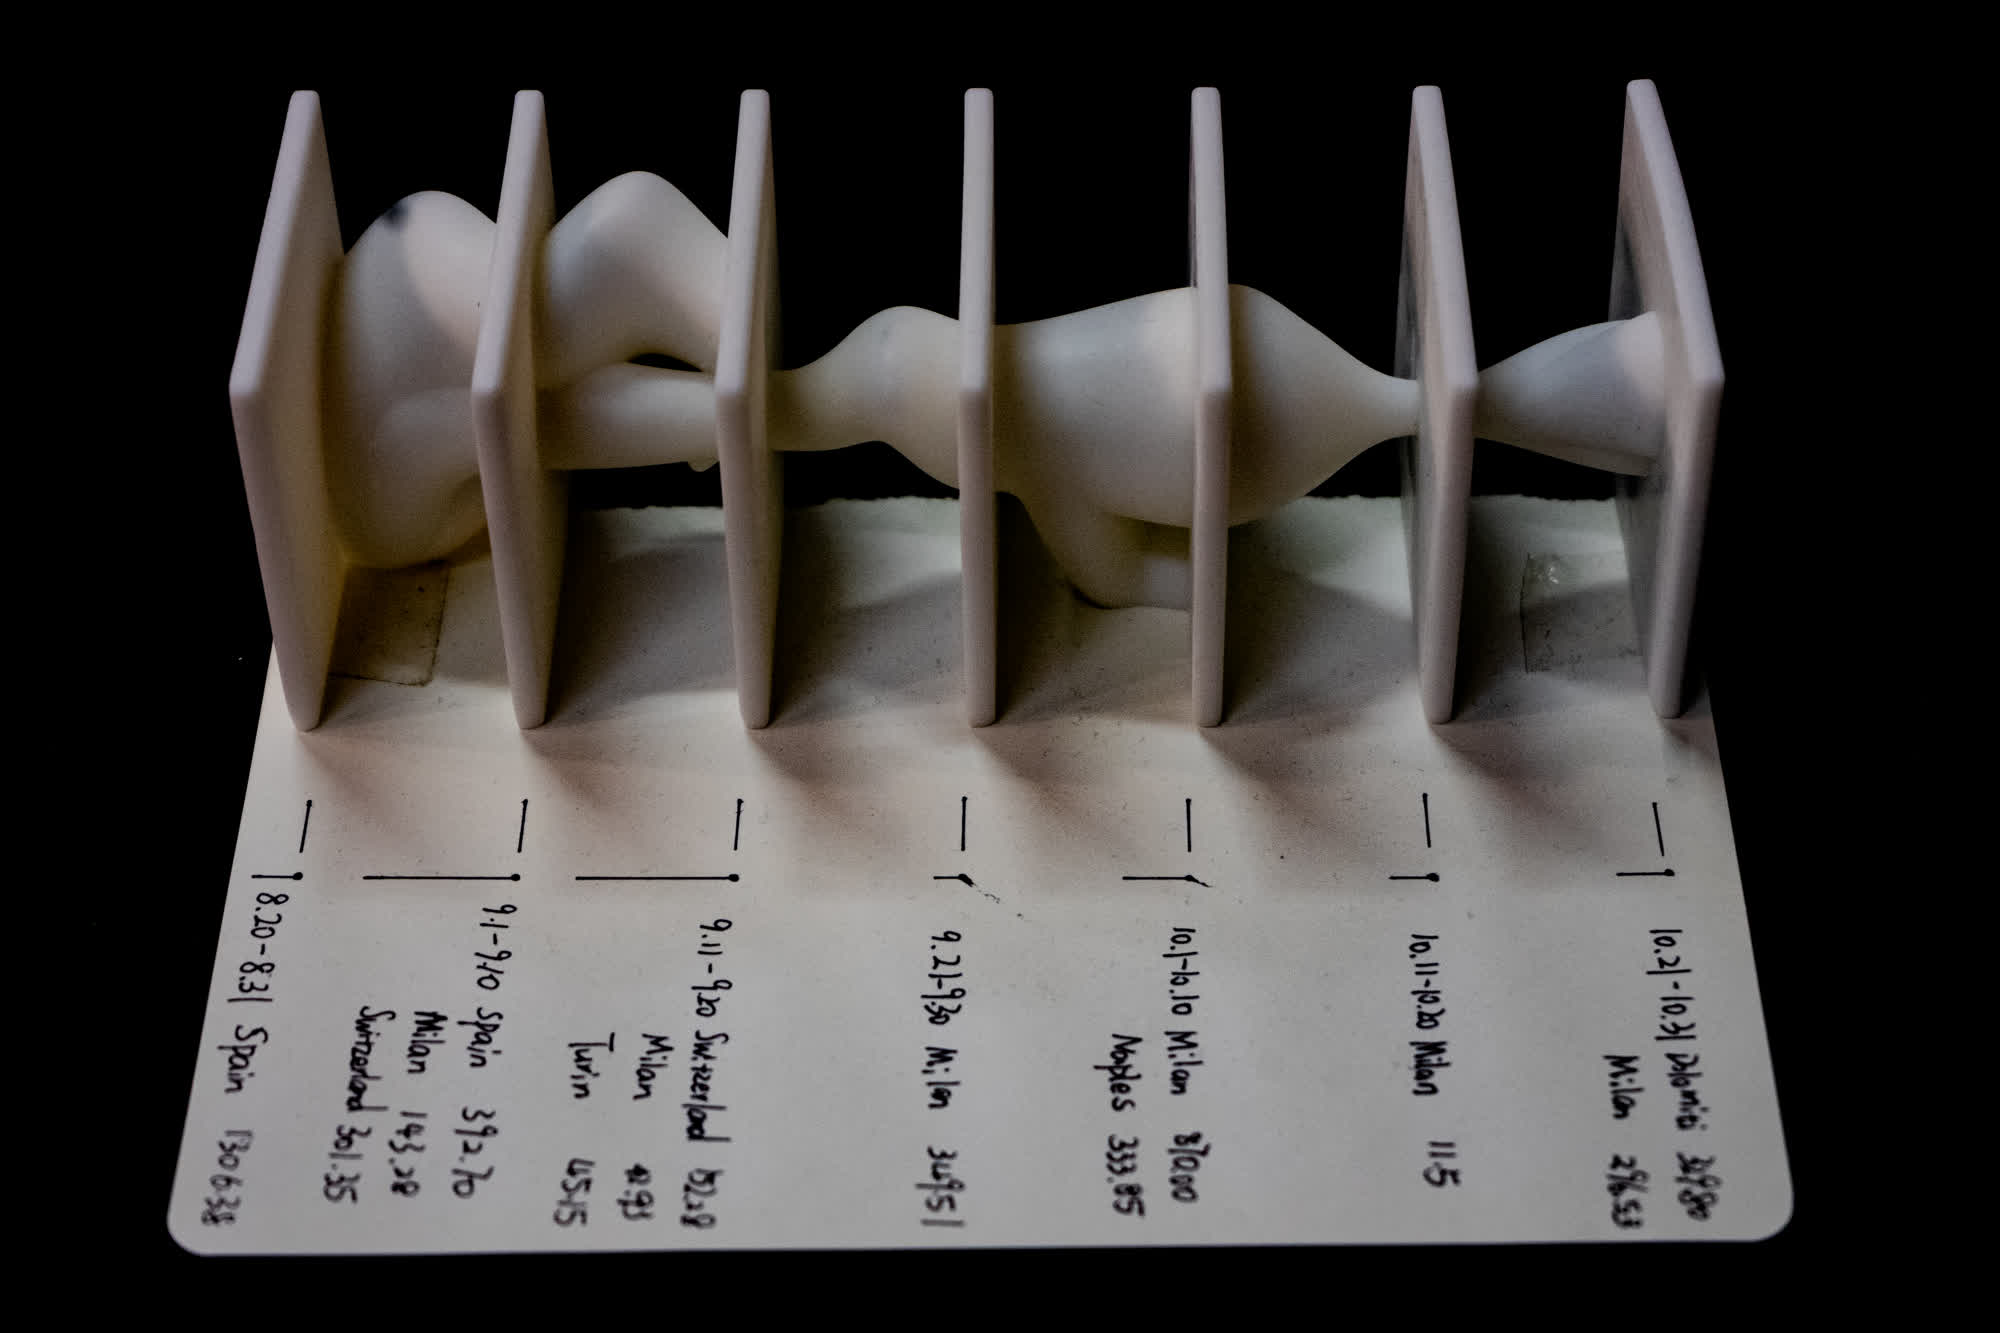
My infopoem is a visual journey encapsulating three months of travel. With data segmented every ten days, delves into the fusion of location, time, expenses, and activities. The 3D model unveils the economic realities behind each destination, emphasizing the connection between social media portrayals and financial undertones in my past experiences. The project prompts reflection on the authentic representation of journeys, shedding light on the subtle dynamics between travel chronicles and economic disparities. It invites viewers to reassess the narratives presented in the “vibrant tapestry” of social media travel records.

Featured image of the project Behind the Social Media:  Unveiling Economic Realities in 3D Travel Chronicles Complementary image of the project Behind the Social Media:  Unveiling Economic Realities in 3D Travel Chronicles Complementary image of the project Behind the Social Media:  Unveiling Economic Realities in 3D Travel Chronicles

Metaphor used:

I employed the metaphor of a layered 3D model, where each layer symbolizes a ten-day period. Within each layer, varying-sized circles represent expenditures, with size denoting the amount spent. The circles' positions on the square layers signify the relative locations of travel destinations concerning Milan. This metaphor was chosen to visually convey the temporal and spatial dimensions of my travel expenditures, creating a tangible representation of the financial journey over time.

Intended Meaning:

Addressing the gap between social media travel narratives and international students' economic struggles, my design prompts reflection on authentic storytelling by visually comparing travel chronicles and financial data.

Source:

Dataset coming from expenditures during the past three months of travel, encompassing location, time, expenses, and detailed activities.