2011 Italian facilities’ pollution
By Alessandro Tosi
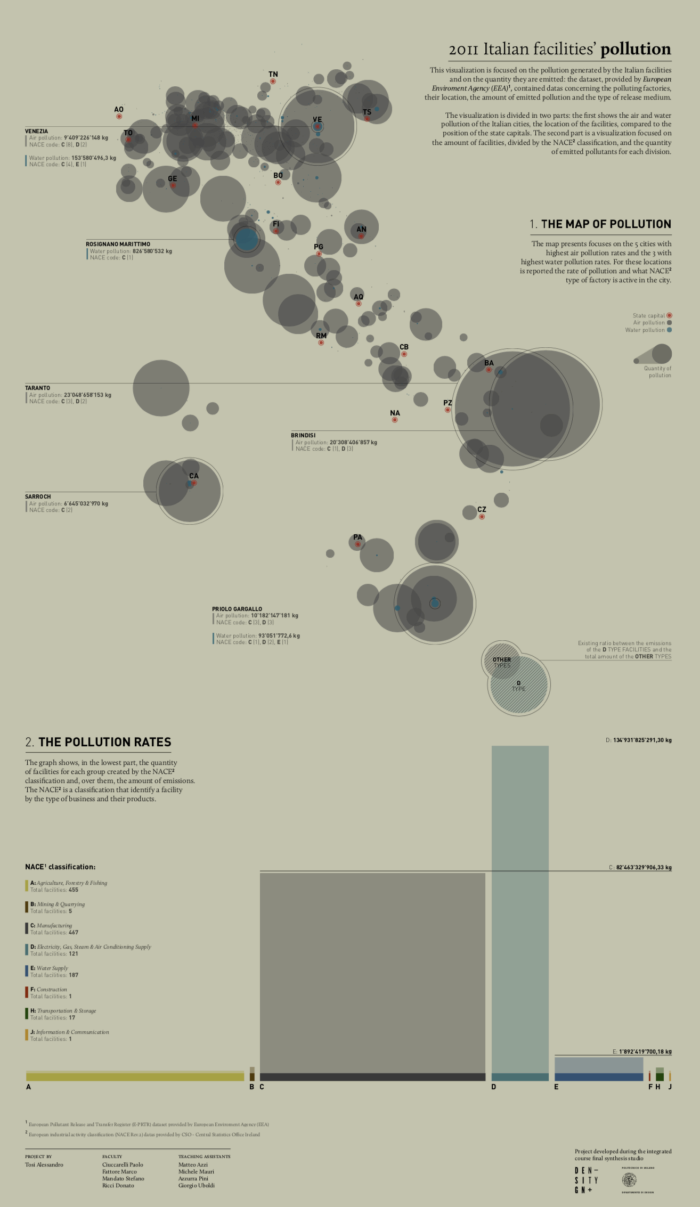
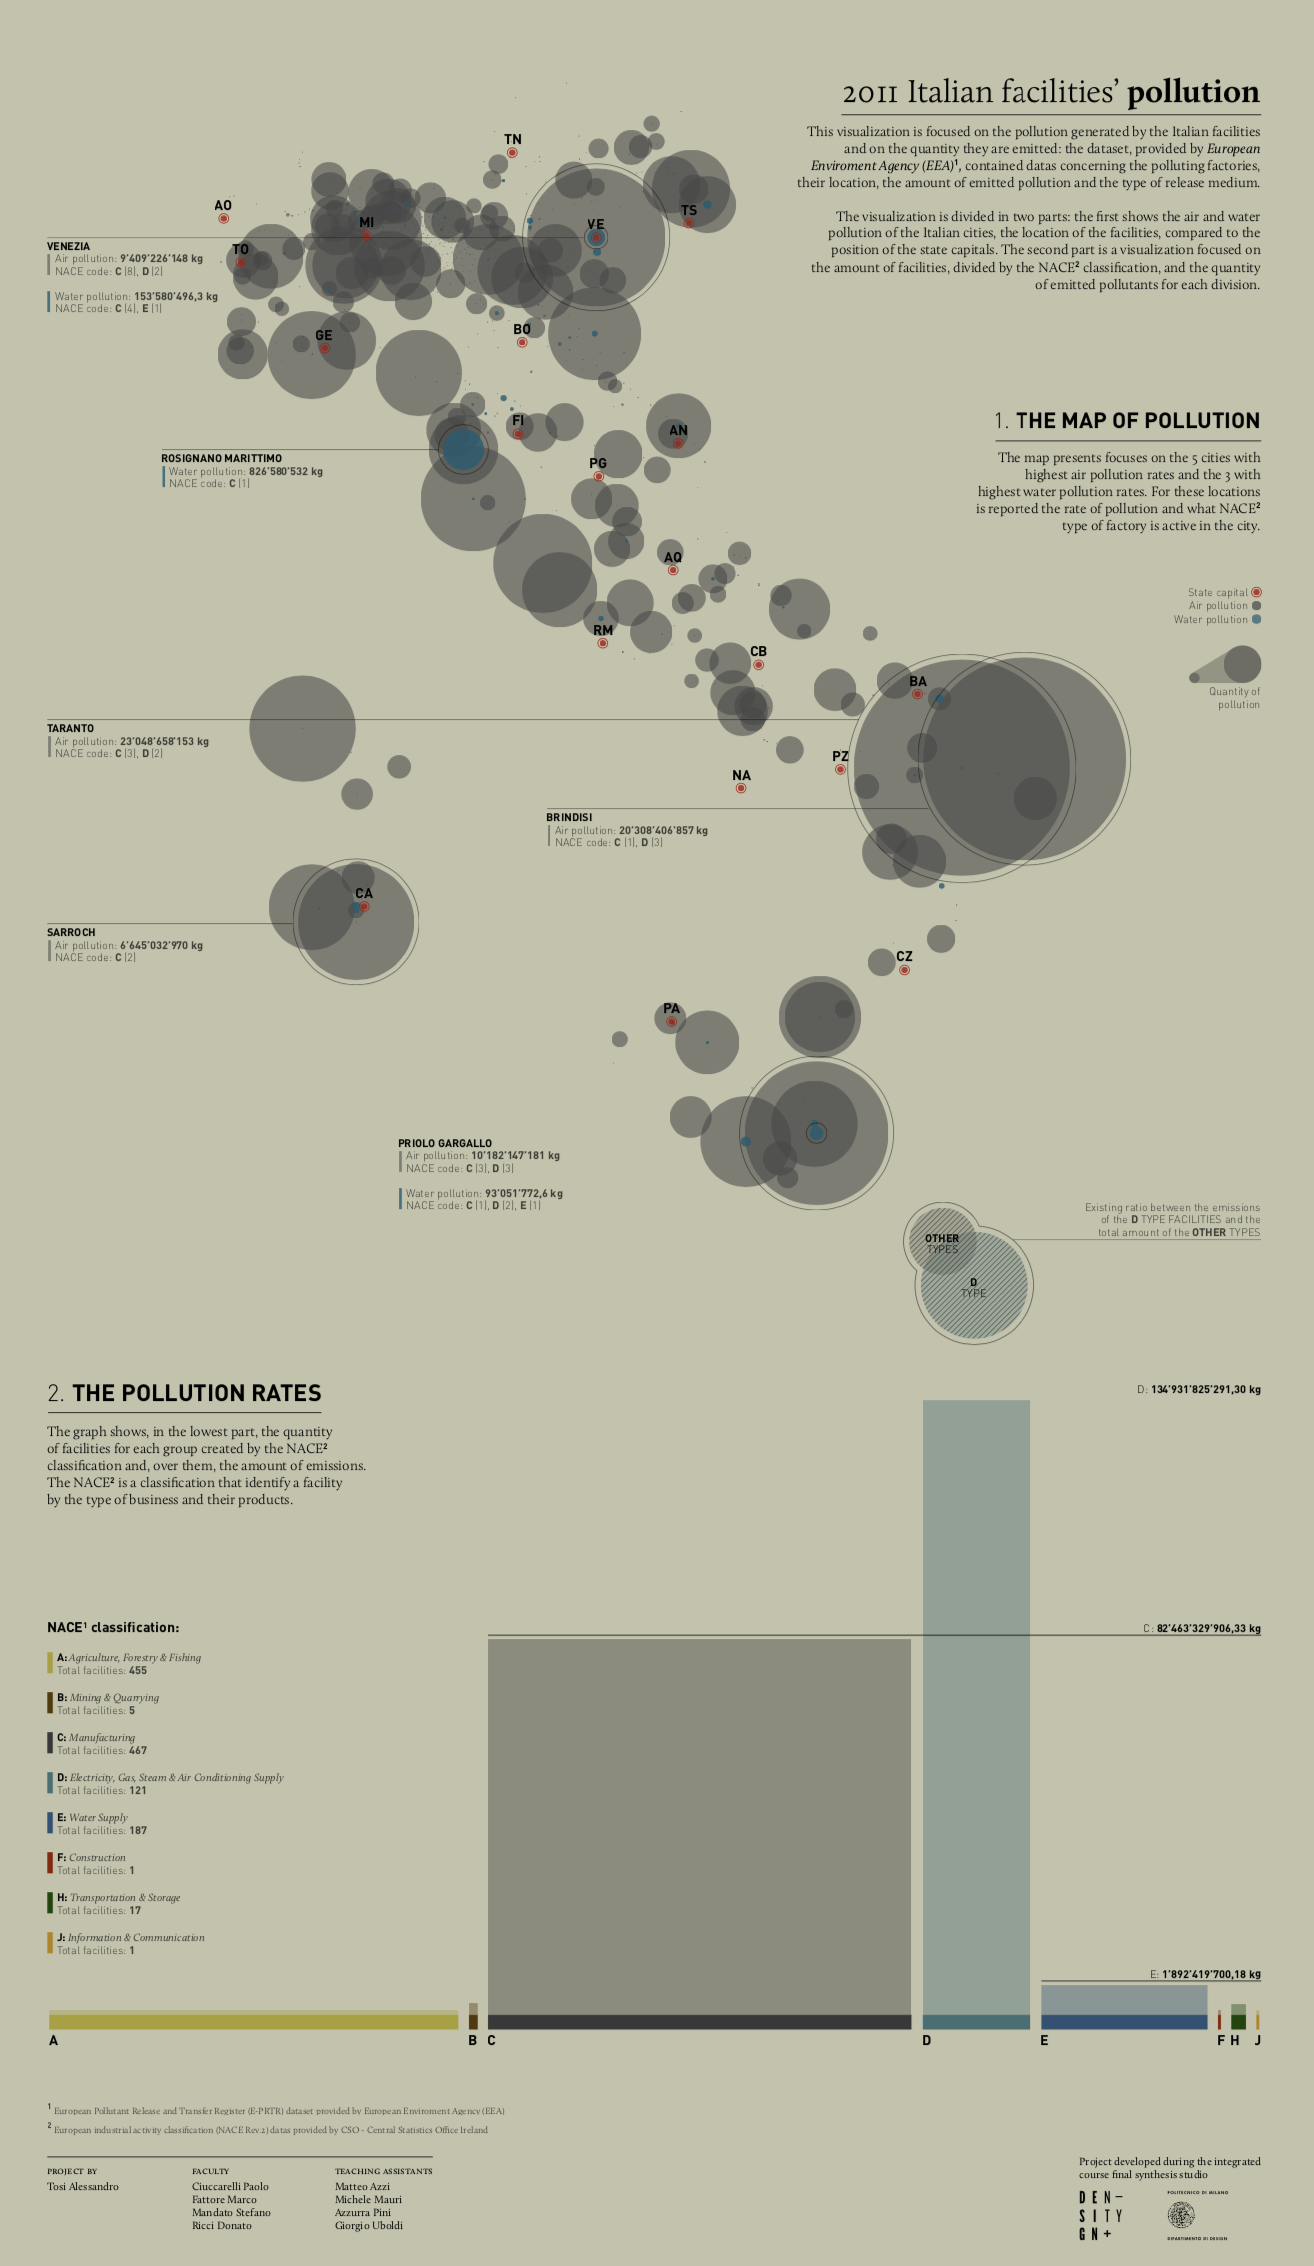
This visualization is focused on the pollution generated by the Italian facilities and on the quantity they are emitted: the dataset, provided by European Environment Agency (EEA)1, contained datas concerning the polluting factories, their location, the amount of emitted pollution and the type of release medium. The visualization is divided in two parts: the first shows the air and water pollution of the Italian cities, the location of the facilities, compared to the position of the state capitals. The second part is a visualization focused on the amount of facilities, divided by the NACE2 classification, and the quantity of emitted pollutants for each division.